- Gaussian
Capabilities - Chemistry
in Solution - Investigating
Large Systems - Modeling
Spectroscopy - Excited
States - Powerful
& Simple
Gaussian 16 is the latest version of the Gaussian series of electronic structure programs, used by chemists, chemical engineers, biochemists, physicists and other scientists worldwide. Gaussian 16 provides a wide-ranging suite of the most advanced modeling capabilities available. You can use it to investigate the real-world chemical problems that interest you, in all of their complexity, even on modest computer hardware.
What Sets Gaussian 16 Apart from Other Software?
- Gaussian 16 produces accurate, reliable and complete models without cutting corners.
- A wide variety of methods makes Gaussian 16 applicable to a broad range of chemical conditions, problem sizes and compounds.
- Gaussian 16 provides state-of-the-art performance in single CPU, multiprocessor and multicore, cluster/network and GPU computing environments.
- Setting up calculations is simple and straightforward, and even complex techniques are fully automated. The flexible, easy-to-use options give you complete control over calculation details when needed.
- Calculation results are presented in natural and intuitive graphical form by GaussView 6.
Fundamental Capabilities
Starting from the fundamental laws of quantum mechanics, Gaussian 16 predicts the energies, molecular structures, vibrational frequencies and molecular properties of compounds and reactions in a wide variety of chemical environments. Gaussian 16’s models can be applied to both stable species and compounds which are difficult or impossible to observe experimentally, whether due to their nature (e.g., toxicity, combustibility, radioactivity) or their inherent fleeting nature (e.g., short-lived intermediates and transition structures).
With Gaussian 16, you can thoroughly investigate the chemical problems that interest you. For example, not only can you minimize molecular structures rapidly and reliably, you can also predict the structures of transition states, and verify that the predicted stationary points are in fact minima or transition structure (as appropriate). You can go on to compute the reaction path by following the intrinsic reaction coordinate (IRC) and determine which reactants and products are connected by a given transition structure. Once you have a complete picture of the potential energy surface, reaction energies and barriers can be accurately predicted. You can also predict a wide variety of chemical properties.
Gaussian 16 offers a wide range of methods for modeling compounds and chemical processes, including:
Molecular Properties in Gaussian 16
Antiferromagnetic coupling
Atomic charges
ΔG of solvation
Dipole moment
Electron affinities
Electron density
Electronic circular dichroism (ECD)
Electrostatic potential
Electrostatic potential-derived charges
Electronic transition band shape
High accuracy energies
Hyperfine coupling constants (anisotropic)
Hyperfine spectra tensors (including g tensors)
Ionization potentials
IR and Raman spectra*
Pre-resonance Raman spectra*
Resonance Raman spectra
Molecular orbitals
Multipole moments
NMR shielding and chemical shifts
NMR spin-spin coupling constants
Optical rotations (ORD)
Polarizabilities/hyperpolarizabilities
Raman optical activity (ROA)*
Thermochemical analysis
UV/Visible spectra
Vibration-rotation coupling
Vibrational circular dichroism (VCD)*
Vibronic (absorption and emission) spectra
*Harmonic approx. and including anharmonic effects
- Molecular mechanicsEGF: Amber, UFF, Dreiding
- Semi-empirical methodsEGF†: AM1, PM6, PM7, DFTB, among others
- Hartree-FockEGF
- Density functional (DFT) methodsEGF, with support for a plethora of published functionals; long-range and empirical dispersion corrections are available where defined
- Complete active space self-consistent field (CASSCF)EGF, including RAS support and conical intersection optimizations
- Møller-Plesset perturbation theory: MP2EGF, MP3EG, MP4(SDQ)EG, MP4(SDTQ)E, MP5E
- Coupled cluster: CCDEG, CCSDEG, CCSD(T)E
- Brueckner doubles: BDEG, BD(T)E
- Outer Valence Green’s Function (OVGF): ionization potentials and electron affinities
- High accuracy energy models: G1-G4, CBS series and W1 series, all with variants
- Excited state methods: TD-DFTEGF, EOM-CCSDEG and SAC-CIEG
EEnergies; GAnalytic gradients; FAnalytic frequencies; F†Reimplemented with analytic frequencies.
A wide range of Gaussian results can be examined with GaussView’s visualization capabilities:
- Molecule annotations and/or property-specific coloring: e.g., atomic charges, bond orders, NMR chemical shifts
- Plots, including NMR, vibrational and vibronic spectra
- Surfaces or contours: e.g., molecular orbitals, electron density, spin density. Properties such as the electrostatic potential can be visualized as a colorized density surface.
- Animations: e.g., normal modes, IRC paths, geometry optimizations
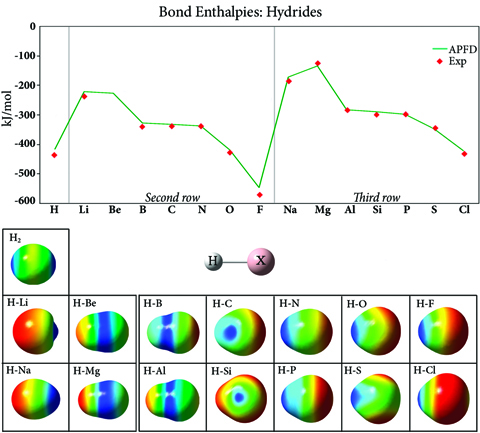
Bond Enthalpies and Electrostatic Potentials in Hydrides
This graph plots the bond strength in second and third row hydride compounds (experiment: [CRC00]), which generally increases across the periodic table, with the strongest bond occurring in the element just before the noble gas. The plot has a similar overall shape for both rows, but the values for the third row are higher, due to the additional shielding from the nucleus by the filled second shell. The images show the electrostatic potential for each compound mapped onto an isodensity surface. The H2 surface illustrates the covalent nature of this bond; the bonds in the other hydride compounds are ionic. The negative electrostatic potential (red) is localized on the hydrogen atom at the beginning of each row, and it moves to the substituent as the atomic number increases within a row. Thus, hydride bond strengths increase across a period (row) and decrease as you go down a group (column), due to changes in electronegativity.
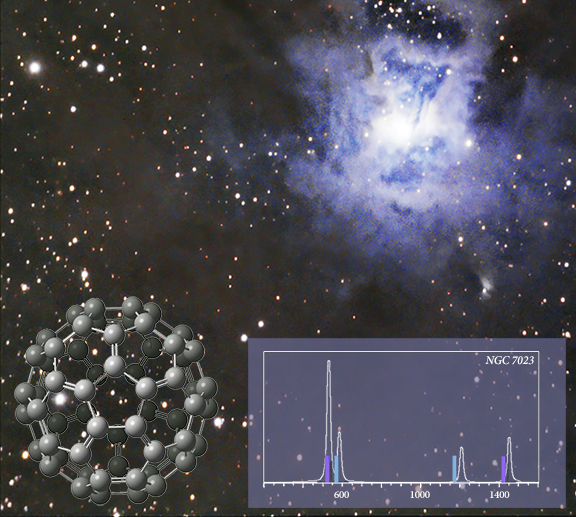
C60 in Interstellar Space
C60 was detected in IR observations of the Iris nebula (NGC 7023) in 2004 [Werner04, Sellgren10]. The inset graph shows the peak locations identified from the data (solid bars) superimposed on the spectrum predicted by the APFD/6-311+G(2d,p) model chemistry. The strongest peaks (purple) differ from the laboratory IR spectrum by 0.03-0.06 μm.
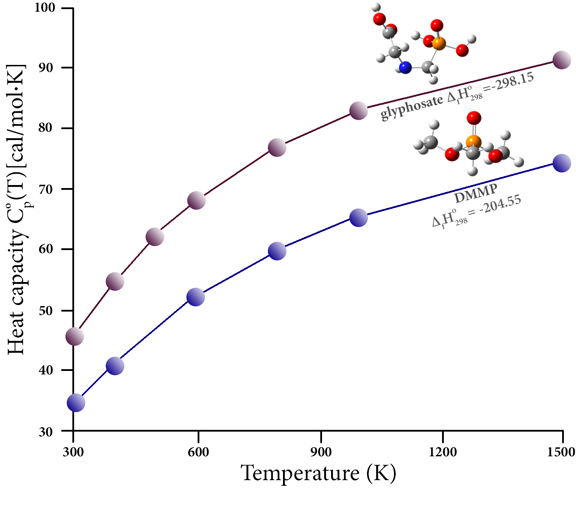
Thermochemistry of Organophosphorous Pesticides
Organophosphorous compounds are commonly used as pesticides (among many other applications). These compounds adversely affect human health, due to both their inherent toxicity and from the harmful products created during combustion (e.g., as a result of burning previously-treated plant material). The decomposition of these compounds is difficult to study experimentally; thermochemical data for them is scarce. However, high accuracy thermochemistry predictions can bridge this gap and allow the thermal stability of the relevant compounds and combustion products to be studied. For example, this graph plots the heat capacity as a function of temperature for two such compounds: the pesticide glyphosate and the more benign flame retardant compound dimethyl methylphosphonate (DMMP). It also reports their heats of formation (kcal/mol), as predicted by the CBS-QB3 calculations of Khalfa and coworkers [Khalfa15]. Their paper presents computed results for a large number of trivalent and pentavalent phosphorus compounds, data which enables them to propose 83 original groups for use in the semi-empirical group contribution method of Benson, and thereby allows them to evaluate the thermochemical properties of some common pesticides, herbicides and related compounds.
Explore Exotic Parts of the Periodic Table
Gaussian provides features for modeling heavy elements for which relativistic effects are significant. The Stuttgart-Dresden and Ahlrichs group basis sets+ECPs are built-in, and their treatments of specific elements can be merged with other standard basis sets via very simple input specifications.
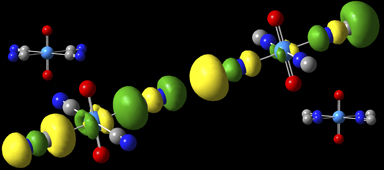
Highest occupied MOs for [UO2(NC)4]2– and [UO2(CN)4]2-
These compounds were modeled with the B3LYP/aug-cc-pVDZ model chemistry, using the Stuttgart/Dresden ECP and [7s 6p 5d 3f] basis set on uranium [Sonnenberg05]. In general, the MOs are more stabilized in the CN– complex (left) compared to the NC– complex (right). For example, in the HOMOs, the 5σ orbitals localized on the carbon atoms are pointing toward the uranium atom in the former while they are pointing away from it in the latter, and the group’s bond length to the U is 0.13Å longer in CN– complex.
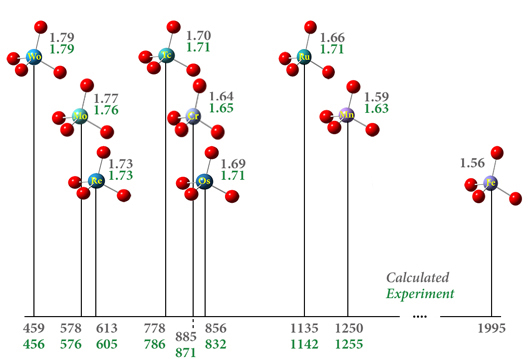
17O Chemical Shifts in Transition Metal Complexes
This figure reports the predicted chemical shift with respect to water vapor (ppm) and the oxygen-substituent bond length (Å) for a series of transition metal complexes (values in grey). These compounds are modeled using the APFD functional with the def2-TZVPP basis set and ECPs on the metal atoms. The results are in excellent agreement with experiment (values in green: [Kaupp95, Kaupp95a]).
Chemistry in Solution
A substantial part of interesting chemical processes occurs in solution. The presence of a solvent can change molecular structure, molecular properties, the relative energies of isomers, the relative abundances of conformations, and many other important factors. Chemistry can also change from one solvent to another.
All available molecular properties can be predicted in solution. Solvation can be included in calculations on both ground state and excited state systems and in ONIOM models.
SCRF in Gaussian 16
Compounds in solution are modeled with the self-consistent reaction field (SCRF) facility in Gaussian 16, the most advanced implementation available for this technique for handling solvation. Some of its major distinguishing feautures include:
- Correct solvent response within the cavity by accounting for the so-called escaped charge density outside the cavity.
- A continuous surface charge formalism that ensures continuity, smoothness and robustness of the reaction field, and which also has continuous derivatives with respect to atomic positions and external perturbing fields.
- Integrated with excited state features:
- Equilibrium and non-equilibrium solvation for excited state calculations to treat the two different ways in which the solvent can respond to changes in the state of the solute: by polarizing its electron distribution (a very rapid process), and by the solvent molecules reorienting themselves (a much slower process). An equilibrium calculation describes a situation where the solvent had time to fully respond to the solute (in both ways), e.g., a geometry optimization (a process that takes place on the same time scale as molecular motion in the solvent). A non-equilibrium calculation is appropriate for processes which are too rapid for the solvent to have time to fully respond, e.g. a vertical electronic excitation.
- An external iteration procedure which allows partial relaxation of the excited state reaction field, as is appropriate for fluorescence and phosphorescence.
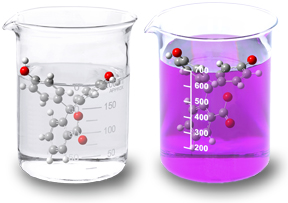
Structure and Property Changes in Solution
Phenolphthaline is the best known example of a change in molecular structure in solution. Its characteristic color change from clear in acidic solutions to pink in basic solutions results from a shift from a neutral lactone form to a phenolate (anion) form. In fact, the compound takes on two additional forms: in very strong acidic and in basic environments.
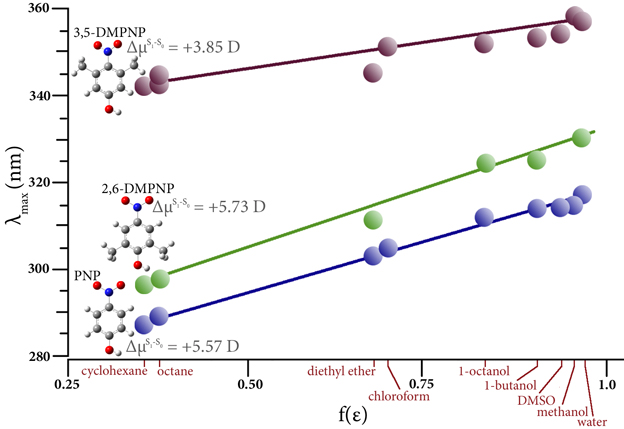
Solvatochromism
Solvatochromism is the ability of the solvent environment to alter the relative energies of ground and excited electronic states. This effect is typically seen in the absorbance spectrum of solutes whose excited states involve movement of electrons across the molecule. The figure plots the observed maximum absorption vs. the Onsager function of the solvent dielectric constant for three compounds in a range of solvents [Steel09]. There are two different solvatochromic behaviors. The electronic transitions in PNP and 2,6-DMPNO strongly depend on solvent polarity, while in 3,5-DMPNP λmax is shifted much less significantly. An electronic shift to longer wavelength means that the solute’s dipole is larger in the excited state relative to the gound state, and the differences in μ predicted by TD-DFT support the observed data.
Accurate Free Energies of Solvation
The energy change going from the gas phase to solution is known as the solvation energy of a molecule. It can be computed for the same compound with several solvents in order to understand its relative solubility in different environments. The predicted free energy can also be used to predict reaction energies in solution. The SMD method is an SCRF-based solvation model from Truhlar and coworkers [Marenich09]. It was parametrized specifically to predict free energies of solvation, and includes different values for the non-electrostatic terms.
Investigating Large Systems with ONIOM
The wide variety of theoretical methods and basis sets available in Gaussian include many that are highly accurate. Unfortunately, such model chemistries scale unfavorably with the size of the molecule, resulting in a practical limit on how large a system can be studied. Gaussian’s ONIOM facility provides a means for overcoming these limitations, allowing you to study large systems that would otherwise be out of reach to all but the cheapest methods. Originally developed by Morokuma and coworkers [Dapprich99], this computational technique models large molecules by defining two or three layers within the structure that are treated at different levels of accuracy. Calibration studies [Dapprich99, Vreven06a] demonstrated that the resulting predictions are essentially equivalent to those that would be produced by the high accuracy method alone on the entire molecule.
ONIOM first appeared in Gaussian 98, and significant innovations over the years make it applicable to much larger molecules. Today, the ONIOM method is applicable to large molecules in many other areas, including enzyme reactions, reaction mechanisms for organic systems, cluster models of surfaces and surface reactions, photochemical processes of organic species, substituent effects and reactivity of organic and organometallic compounds, and homogeneous catalysis. For a recent review of the ONIOM method and many exemplary applications, see [Chung15] by Chung, Morokuma and coworkers.
In addition to modeling systems which are too large to address as a whole by a method with the desired accuracy, ONIOM calculations are also useful for other chemical situations:
- Compounds whose chemistry occurs within a protein environment. In such cases, ONIOM is needed both because of the sheer size of the molecule and because modeling, e.g., a chromophore in isolation is a poor model for its actual emission reaction.
- Steric effects arising from ligands are another example where ONIOM aids in accurately modeling the fundamental chemistry. Ligands can be bulky and flexible, and compounds containing them can be too large to optimize with a desired method. However, merely truncating the ligands can lead to poor agreement with observations since they significantly influence molecular structure and reactivity. Modeling such systems with ONIOM, using either QM:QM or QM:MM methods, is both feasible and successful.
- ONIOM may be useful for molecules whose size does not make them prohibitively expensive to model in a single form but for which there are a large number of conformations. ONIOM can aid in the conformation search process by significantly reducing the time required for each individual optimization.
What is Unique About ONIOM in Gaussian 16?
Many programs now include some version of QM:MM models (also known as MO:MM). However, Gaussian 16’s ONIOM facility is far more advanced and robust for several reasons:
- It is a general facility allowing you to use any method for any layer, supporting both QM:MM and QM:QM models, with two or three layers.
- Efficient and reliable energies, optimizations and frequencies are provided. Vibrational frequencies of the entire system can be efficiently computed without neglecting any MM coupling terms.
- True IRC calculations can be performed (rather than mere “coordinate driving”).
- Wavefunction stability testing and optimization are also supported.
- All molecular properties are supported for ONIOM calculations.
- ONIOM models can treat excited states.
- Different initial guesses can be specified for each ONIOM layer, including retrieving results from previous jobs.
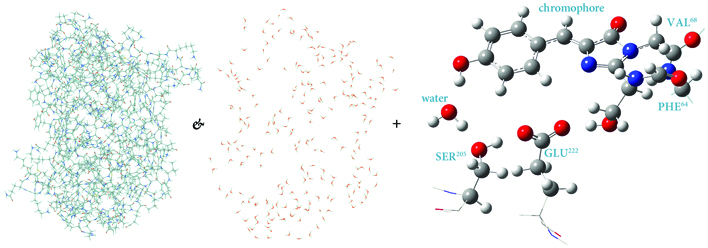
ONIOM Layers for Modeling GFP
Green fluorescent protein (GFP) is the molecule responsible for fluoresence in jellyfish. When exposed to light in the proper frequency range, it emits bright green light. It is a molecule that is ideal for modeling with ONIOM. The figure illustrates one possible partitioning for an ONIOM model. The majority of the protein and the crystallographic waters are placed in the ONIOM MM region (low layer) while the chromophore and important atoms on nearby residues comprise the QM region (high layer). Including the protein environment within the calculation is essential to determining the structure of the chromophore.
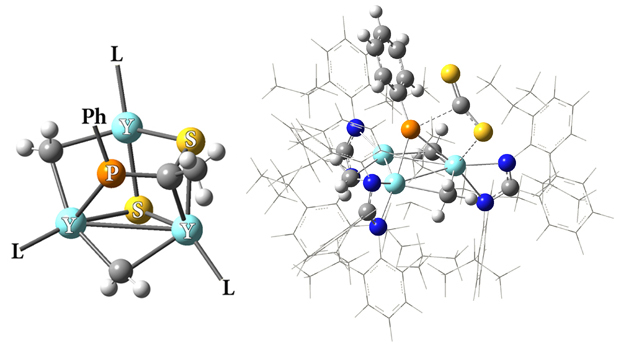
A Novel Yttrium-Phosphinidene Complex
Zhang and coworkers recently synthesized two novel trinuclear rare-earth metal phosphinidene complexes [Wang15]. The illustration focuses on the compound containing yttrium (the other complex contains lutetium). The central part of the newly-synthesized compound appears on the left, with the phenol group and the ligands truncated for clarity. The molecule on the right shows the partitioning used for their related ONIOM calculations; it depicts the first step of their proposed pathway, the reaction of the phosphinidene complex {[PhC(NC6H4iPr2-2,6)2]–(Y)(μ2-Me)}3(μ3-Me)(μ3-PPh) with CS2 in toluene. The high accuracy region contains the Y and P atoms and the most important groups bonded to them, the CS2 molecule weakly bound to the cluster, as well as the N-C-N group from each ligand. ONIOM (QM:QM) calculations allowed this very large molecule to be studied with accurate methods; the high layer used a DFT model, while Hartree-Fock was used for the bulk of the ligands. On the basis of their calculations, these researchers identified a potential pathway for the complete synthesis.
Modeling Spectroscopy
Spectroscopy is a fundamental tool for investigating molecular structures and properties. However, observed spectra are often difficult to interpret. The results of electronic structure calculations can be vital to this process. For example, predicted spectra can be examined in order to determine peak assignments in observed spectra as well as to compare peak locations and intensities with experimental data. Gaussian 16 can also compute relevant spectroscopic constants and related molecular properties with excellent accuracy. This combination of experimental observation and theoretical computation can yield very accurate structural and spectral data for compounds of interest.
Gaussian 16 can predict a variety of spectra, in both the gas phase and in solution, including:
- IR and Raman
- NMR spectra and spin-spin coupling constants
- Vibrational circular dichroism (VCD)
- Raman optical activity (ROA)
- Resonance Raman
- UV/Visible
- Vibronic absorption and emission spectra for excited states, via Franck-Condon and/or Herzberg-Teller analysis
- Electronic circular dichroism (ECD) and circularly polarized luminescence (CPL)
- Optical rotatory dispersion (ORD)
- Hyperfine (microwave spectroscopy)
- Anharmonic analysis is available for IR, Raman, VCD and ROA spectra.
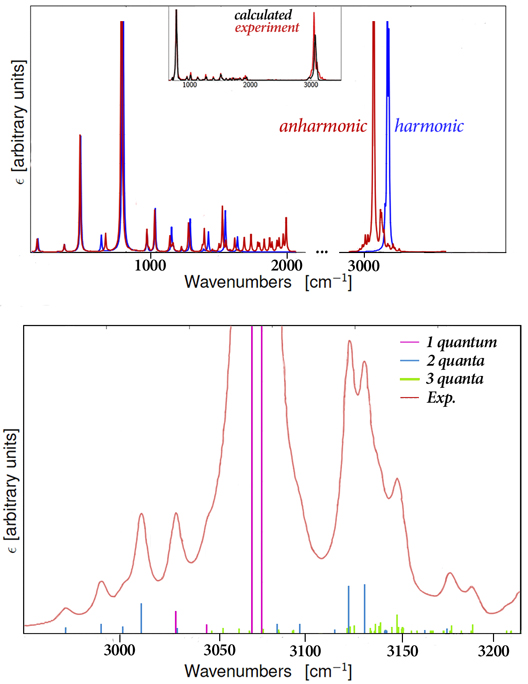
Harmonic vs. Anharmonic IR Spectrum of Naphthalene
Vibrational frequency analysis performed by default uses the harmonic approximation for performance reasons; it assumes that there are no interactions between vibrational modes. As a result, such analysis can only predict fundamental bands. However, observed spectra also often include overtone and combination bands. Anharmonic frequency analysis must be used to predict the latter band types and to achieve agreement with experiment in many cases. This figure illustrates the predicted IR spectrum for naphthalene. The harmonic (blue) and anharmonic (red) spectra are compared; in addition to shifting the location of several peaks, the anharmonic spectrum exhibits considerably more complexity (see, e.g., the 1600-2000 cm–1 range and the region above ~3000 cm–1). The anharmonic spectrum is plotted against experiment in the inset. The bottom plot focuses on the 2950-3250 cm–1 region and shows the contributions of fundamental, 2-quanta and 3-quanta modes to the overall spectrum.
Modeling NMR Spin-Spin Coupling Constants
Spin-spin coupling constants are one of the most difficult spectral data to produce quantitatively. The accuracy of calculations is highly dependent on the basis set used. While the standard basis sets of quantum chemistry are well developed for valence electrons, a more sophisticated description of the electron density closer to the nuclei is needed for predicting the Fermi contact (FC) term (often the spin-spin coupling constants’ largest component). Researchers at Gaussian, Inc. have explored this problem in depth and have developed modified basis sets suitable for modeling these quantities within a DFT framework [Deng06]. Gaussian 16 can automatically perform a two-step calculation for NMR spin-spin coupling, using the standard basis set for the general calculation and the corresponding modified basis set for the FC term.
| Basis Set | Derived from | Accuracy Improvement |
|---|---|---|
| uTZ-w | aug-cc-pVTZ | 650% (ΔAAE=-20 Hz, AAE=3.6 Hz) |
| uDZ-w | aug-cc-pVDZ | 590% (ΔAAE=-41 Hz, AAE=8.7 Hz) |
| uG-w | 6-311+G(d,p) | 415% (ΔAAE=-33 Hz, AAE=10.3 Hz) |
Larger improvement percentages are better (AAE: average absolute error with respect to the basis set limit). Recommended basis sets are arranged from largest (top) to smallest.
Studying Chirality
Chiral molecules are of great importance in many research contexts. Gaussian 16 can study chirality with several techniques including two spectroscopic classes: VCD and ROA. Both types of spectra can be predicted including anharmonic vibrational analysis.
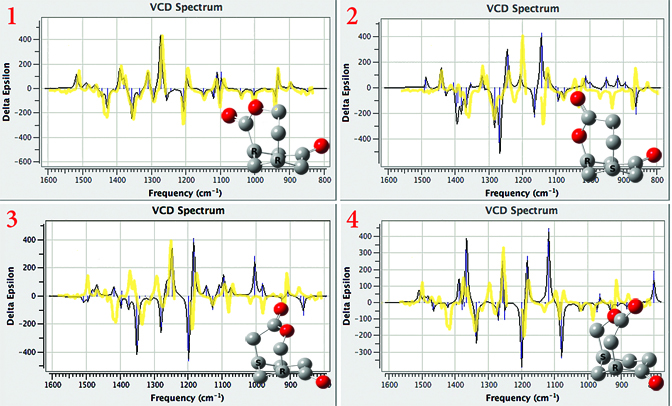
Distinguishing Chiral Products with VCD
The Baeyer-Villiger oxidation of (+)-(1R,5S)-bicyclo[3.3.1]nonane-2,7-dione has four possible keto-lactone products. VCD calculations can determine which one is the actual product by comparing their predicted spectra to the observed one. We’ve overlaid the observed spectrum (yellow, from [Stephens05a]) on each of the plots. Isomer 1 can be identified as the product structure, and there is excellent agreement between theory and experiment.
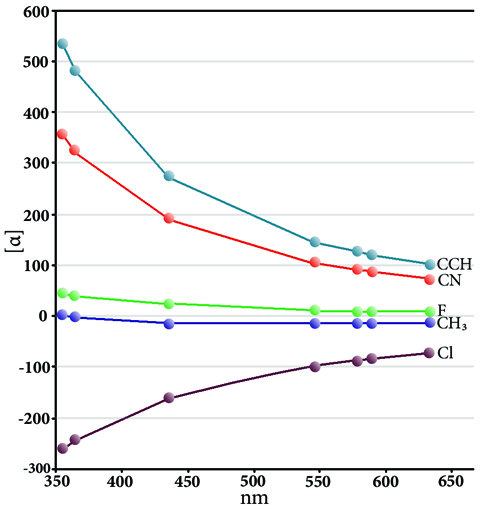
ORD Spectra of Substituted Oxiranes
When polarized light travels through some materials, it is rotated with respect to the direction of motion. Such materials include crystals, spin-polarized molecules in the gas phase and chiral molecules. As with other observed effects of chirality, optical rotation differs for left and right circularly polarized light, and it can give important information about molecular structure for chiral molecules. Observed optical rotations vary for the same substance according to the wavelength of the incident light. This variation is known as optical rotatory dispersion (ORD). ORD results plot the observed rotation for various incident light wavelengths. This plot shows the predicted optical rotations for a series of substituted oxirane compounds for a series of incident light frequencies in the range 350-650 nm [Wilson05, Wiberg07]. In general, the curves exhibit increased specific rotations with decreasing incident light frequency. The chlorine compound is an exception, and it exhibits an opposite change, an example of the anomeric effect; here, electron density moves from the lone pair to the σ* orbital of the C–Cl bond, resulting in a longer bond length and energetic stabilization [Wiberg07].
Modeling Microwave Spectroscopy
Molecular rotational transitions are split by a variety of interactions between the overall rotational motion of the molecule and both the electron distribution and spins of the nuclei, yielding the so-called fine structure, which can be measured with very great accuracy. For molecules with unpaired electrons, the fine structure itself can be further split as a result of additional factors including the magnetic interactions between the magnetic moment and induced fields of the electron with those of the nucleus. The effect is known as hyperfine coupling, and it is studied experimentally with microwave spectroscopy. It can also be modeled by Gaussian.
Calculations can also aid in interpreting experimental data. They suggest regions in which to look for transitions, which can make experiments more efficient. Theoretical results are also useful for making spectral assignments for observed peaks, which can be difficult or impossible to determine solely from the raw experimental data. Computed tensors can also be combined with observations in fitting operations. Using computations to aid in interpreting and fitting observed results should make non-linear molecules as amenable to study as linear ones.
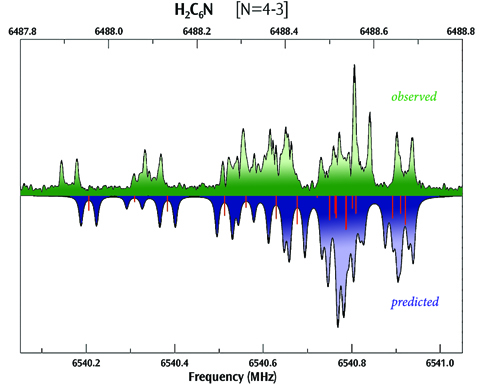
Hyperfine Spectrum for H2C6N
This plot compares the observed (top) and computed (bottom) hyperfine spectra for H2C6N, showing very good agreement between the two (experimental data provided by S. E. Novick, W. Chen, M. C. McCarthy and P. Thaddeus).
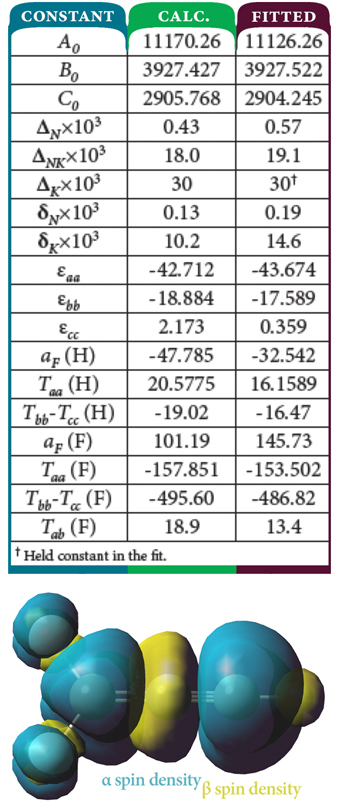
F2CC≡CH Hyperfine Coupling Constants and Spin Density
Researchers have also studied the 1,1-difluoroprop-2-ynyl radical, F2CC≡CH, a partially fluorinated variant of the propargyl radical. The combination of the observed microwave spectral data and calculation of various hyperfine tensors determined that the compound has a planar structure, a somewhat unexpected result. The table at the top compares the predicted values of many constants for this compound with those fitted from experimental data [Kang06], showing excellent agreement between them. The figure below the table shows the spin density for the molecule, with the α spin density in teal and the β spin density in yellow, situated perpendicular (top) and parallel to the plane of the molecule. Note the abundance of α spin density in both potential locations for the unpaired electron—the two end carbon atoms—as well as the small amount of β spin density on the H atom.
Studying Excited State Chemistry
Excited states are relevant to the study of a wide variety of phenomenon, including photosynthesis, photodecomposition, photochemical generation of electricity, perception of light in animals, fluorescence, bioluminescence, and more. Gaussian can calculate UV-Visible spectra, model processes and reactions on excited state potential energy surfaces and predict vibronic absorption and emission spectra. Calculations can be performed in the gas phase and in solution.
Excited state methods and properties received a lot of attention as we developed Gaussian 16. With its analytic TD-DFT frequencies, you can efficiently optimize excited state transition structures, perform IRC calculations and predict vibronic spectra. Analytic EOM-CCSD gradients let you optimize the structures of molecules that require a high accuracy excited state treatment. CASSCF calculations can be performed to model structures for which multireference effects are vital; active spaces of up to 16 orbitals are supported.

Firefly Bioluminescence
Bioluminescence is a fascinating phenomenon: light emission arising from chemical reactions within the bodies of animals (without photon absorption). In fireflies, the best known example of bioluminescence, the luciferin molecule undergoes a two-step enzyme-catalyzed reaction yielding oxyluciferin, a species formed in its excited state; oxyluciferin then decays to its ground state, emitting a yellow-green photon. In some circumstances, the emitted photon is shifted in color to red (the result of an acid environment for the reaction). Theoretical studies of firefly bioluminescence span almost 2 decades, and they use ever more accurate methods for studying it: semi-empirical methods, CI-Singles and, most recently, TD-DFT. Many important questions remain unresolved, though. For example, there are six forms of the bioluminophore oxyluciferin, and the question as to which is the light-emitting molecule is not completely resolved (see, e.g., [Cheng15, daSilva15]). Gaussian 16’s TD-DFT capabilites including analytic frequencies and ONIOM capabilities are ideal for the continued study of this phenomenon.
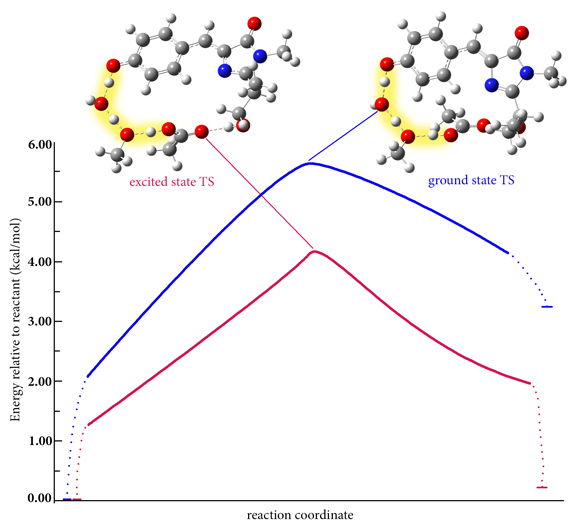
GFP Proton Shuttle Reaction IRC
These plots show idealized intrinsic reaction coordinate paths on the ground state and excited state PESs for the proton shuttle process in green fluorescent protein (GFP) studied by the Rega group (see [Petrone16] for the predicted paths). The S0 and S1 transition structures are illustrated, and the proton shuttling is highlighted. In both the ground state and the excited state, all three proton transfers are concerted and proceed via a single transition state. In the organism, the reaction occurs on the lower energy excited state PES (on average, ~2-3 kcal/mol below the ground state PES). The entire hydrogen bond network is more planar in the excited state, resulting in a tighter chromophore-water-residues packet. While the published results studied a model of the chromophore region, the TD-DFT analytic frequency feature in Gaussian 16 makes it possible to study the reaction in the protein environment with ONIOM.
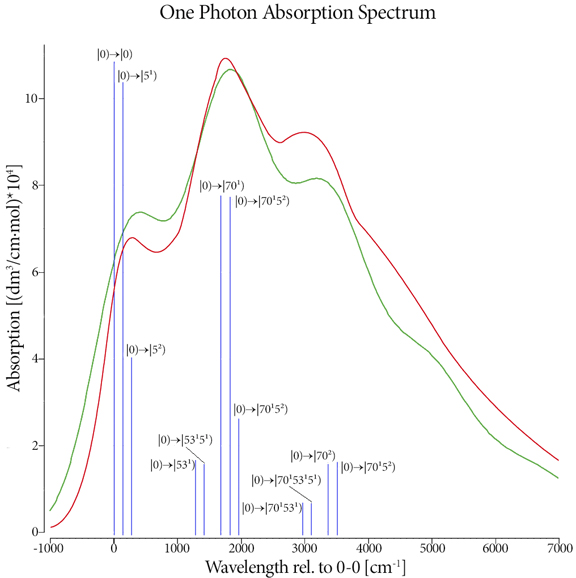
One Photon Absorption Spectrum
This plot shows the predicted (red) and experimental (blue) one photon absorption spectrum for trans,trans-1,4-diphenyl-1,3-butadiene [Foresman15]. The transitions requested in the calculation are represented by the vertical green lines which we have labeled with their specific transition. There is excellent agreement between calculation and experiment.
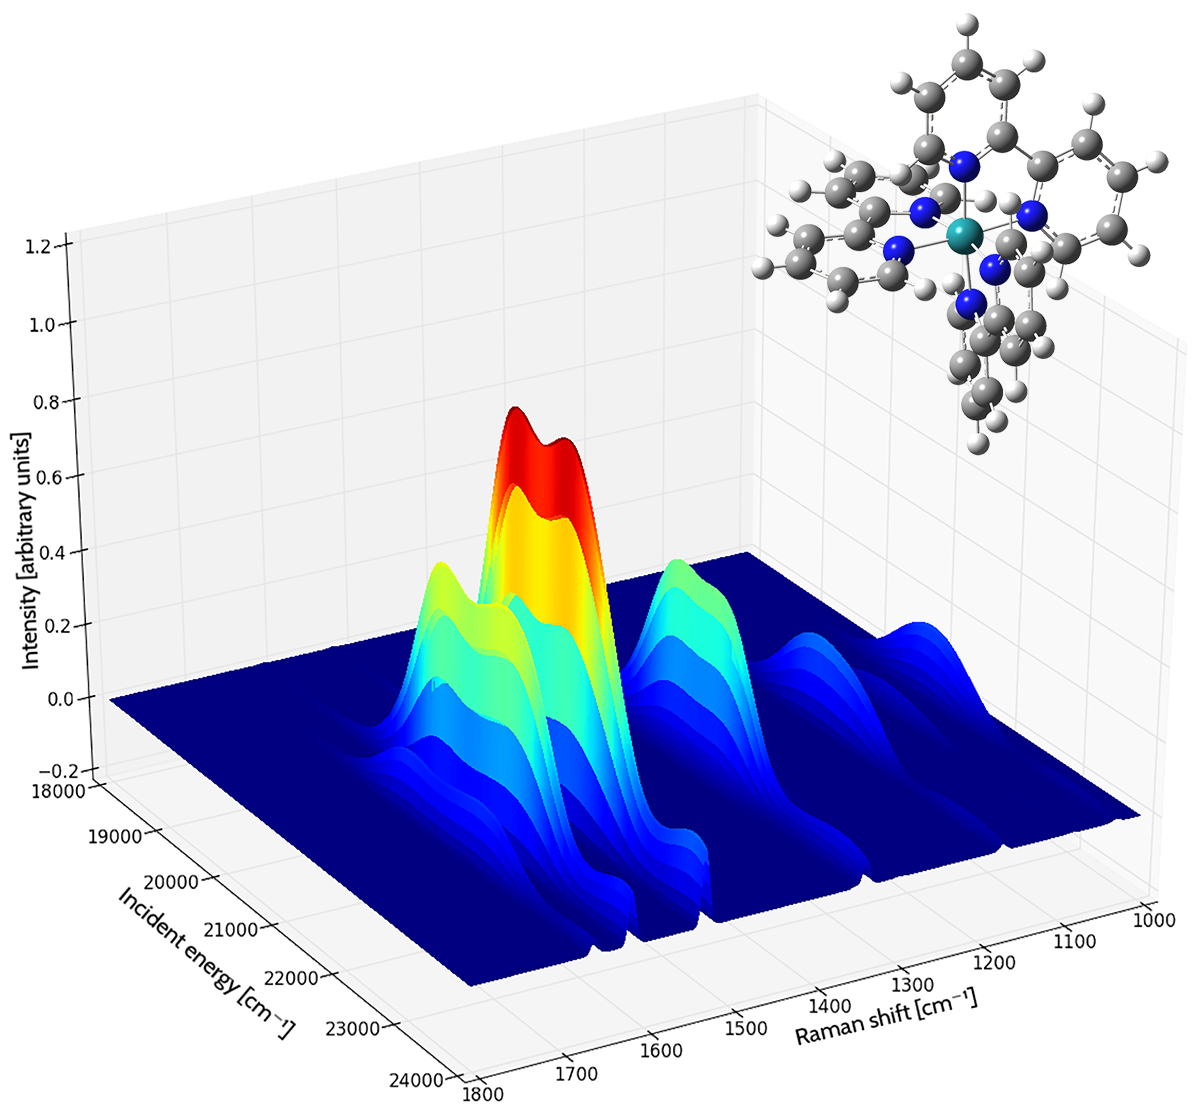
Resonance Raman Spectrum of the tris(2,2’-bipyridyl)-ruthenium(II) Complex
Each curve shows the intensity of the Raman shift produced by various frequencies of incident light. The area under each curve is filled, colored by the magnitude of the intensity (blue to red as the intensity increases). The spectrum was computed in acetonitrile solution [Baiardi14].
Powerful Capabilities, Yet Simple to Use
Gaussian 16 makes running even quite complex calculations very simple to set up and specify. We highlight some of the features which accomplish this goal in this section.
Fragments
Gaussian offers the ability to define regions within a molecule for modeling effects such as antiferromagnetic coupling and computing counterpoise corrections.
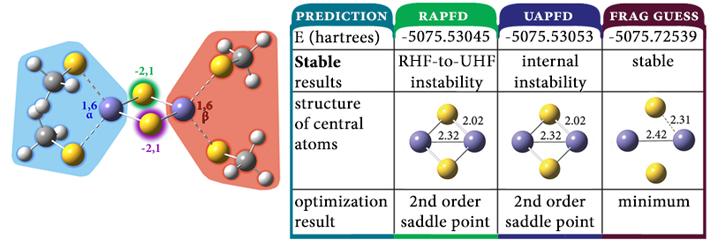
Modeling Antiferromagnetic Coupling
The dimer of FeS(SCH3)2– is a simple model for ferredoxins, a class of proteins that facilitate electron transfer reactions in organisms. Accurately modeling this system requires taking its complex electronic configuration into account: each of the Fe(III) atoms has five unpaired electrons: one iron atom has five α electrons, and the other iron atom has five β electrons. We need to provide these details to Gaussian so that the program can construct an appropriate wavefunction. This can be accomplished by defining regions—fragments—within the molecule for which these items can be specified individually. For this system, we define four fragments as indicated by the colored shading. The results of our complete study of this system indicate that the antiferromagnetic singlet is in fact the ground state wavefunction for this molecule, and the optimization using it successfully locates a minimum. In contrast, optimizations using the default wavefunction for both closed shell and open shell calculations result in second-order saddle points characterized by much shorter Fe-S and Fe-Fe bond lengths. This application is an example of antiferromagnetic coupling: the stabilization in substances in which equal numbers of unpaired electrons of each spin type arranged in a pattern with neighboring spins having opposite polarity.
Wavefunction Stability Analysis
A stability calculation determines whether there is a lower energy wavefunction corresponding to a different solution of the SCF equations than the wavefunction used by default. This analysis involves relaxing the constraints placed on the wavefunction by default: for example, allowing the wavefunction to become open shell or reducing the symmetry of the orbitals. Running a stability calculation can tell you if the wavefunction accurately describes the electronic structure of the molecular system you are studying and to locate a better one if it is not. This analysis is essential for many species. For example, stability analysis of both restricted and unrestricted wavefunctions of ozone will indicate the existence of an instability, and the wavefunction must be optimized before use in later modeling. This result is not surprising for a species like ozone, a singlet with an unusual electronic structure with significantly biradical character resulting from the coupling of the singly-occupied p orbitals on the terminal oxygen atoms.
Intuitive Molecular Orbitals
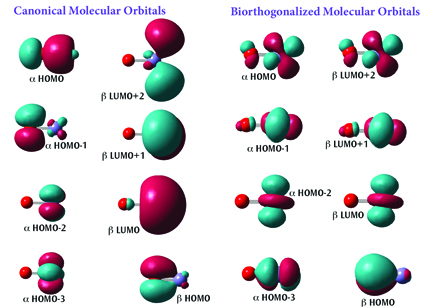
The figure shows two sets of orbitals for FeO+(a quartet system). The default canonical orbitals (left) can be difficult to interpret for molecules like this one since they are spin polarized.
Understanding the set of orbitals is much more straightforward. These orbitals have been biorthogonalized—transformed via an energy-invariant rotation—in order to produce the “corresponding orbitals.” With this representation, it is clear that the molecule contains five singly occupied orbitals: four α unpaired electrons localized on the iron atom, and one β unpaired electron localized on the oxygen atom.
Gaussian 16 can also report the atomic contributions to the molecular orbitals. For example, the α HOMO in the canonical orbital set is composed of about 70% p-orbital on the oxygen and about 20% s-orbital on the iron.
Optimization Aids and Constraints
Gaussian 16 introduces several features which make its geometry optimization facility more powerful and flexible for the user. For example, a new option allows the force constants to be recomputed every nth step of an optimization. This will prove very useful for floppy molecules whose optimizations previously required restarts with Opt=CalcFC to complete successfully. Gaussian can also retrieve the geometry for any step of an optimization from the checkpoint file.
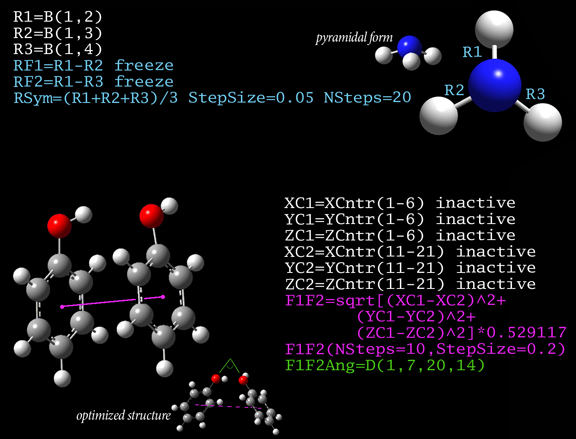
Advanced Structure Constraints
The figure illustrates two types of constraints that can defined using generalized internal coordinates (GICs) and then used in geometry optimizations, relaxed PES scans and other calculations. In the upper part, constraints designed to study the pyramidalization of ammonia with increasing bond length are created. First, the N-H bonds are defined as the variables R1 through R3. These bond lengths are constrained to remain the same by freezing variables defined as their differences (RF1 and RF2) at their current values (i.e., 0). Finally, a scan is set up which gradually increases the bond length in steps of 0.05 Angstroms.
The lower part of the figure shows GICs for phenol dimer. The initial six variable definitions define X, Y and Z coordinates of the centers of the two rings (they are marked inactive since they are intermediates that should be excluded from active optimization). A relaxed PES scan is then performed with this distance as the scan variable (the factor in the expression for F1F2 is for conversion to Angstroms). During the scan, the value of the added dihedral angle coordinate F1F2Ang will be reported (C-O-O-C, where the carbon atoms are in the ring and opposite their oxygen atom); this is the angle between the two rings.
Last updated: 5 July 2017


